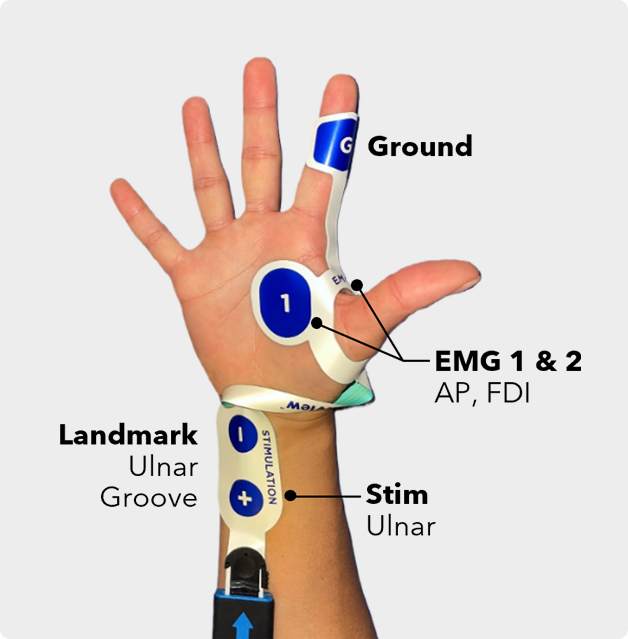
Locate the ulnar groove and place the stimulating electrodes directly over the ulnar nerve just proximal to the wrist crease.
Wrap EMG electrodes 1 & 2 around the inside base of the thumb and pres the curve down into the web space.
Push 1 & 2 down onto the AP & FDI and affix G to the index.
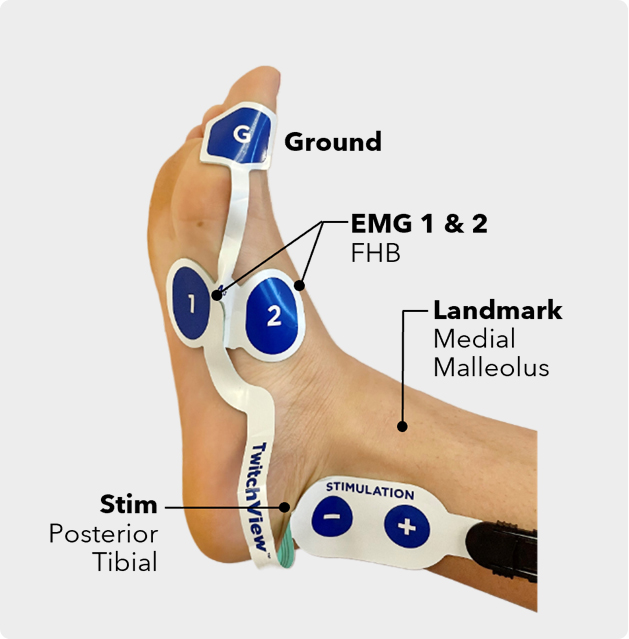
Locate the medial malleolus and place the stimulating electrodes over the posterior tibial nerve next to the bony projection.
Affix 1 & 2 within the foot arch around the flexor hallucis brevis and affix G distally to the ball of the foot or big toe.
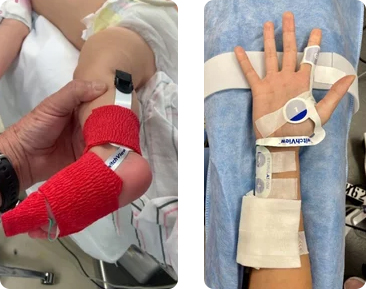
After connecting the electrode to the patient cable, place a 4x4 under the connection and tape in place.
For longer cases with tucked arms, reinforce the electrode with tape or coban to mitigate accidental electrode removal.
1. Reset the monitor between every case. Menu → New Session → OK
2. Connect the electrode to the patient cable The Play button will turn green if the electrode check is passed, and red if the electrode is not inserted or if there is poor contact.
3. Press play, after the patient is anesthetized but before administering NMBA to optimize settings and confirm electrode placement.
4. After Start-up, TwitchView initiates TOF measurements @ 20-second intervals.
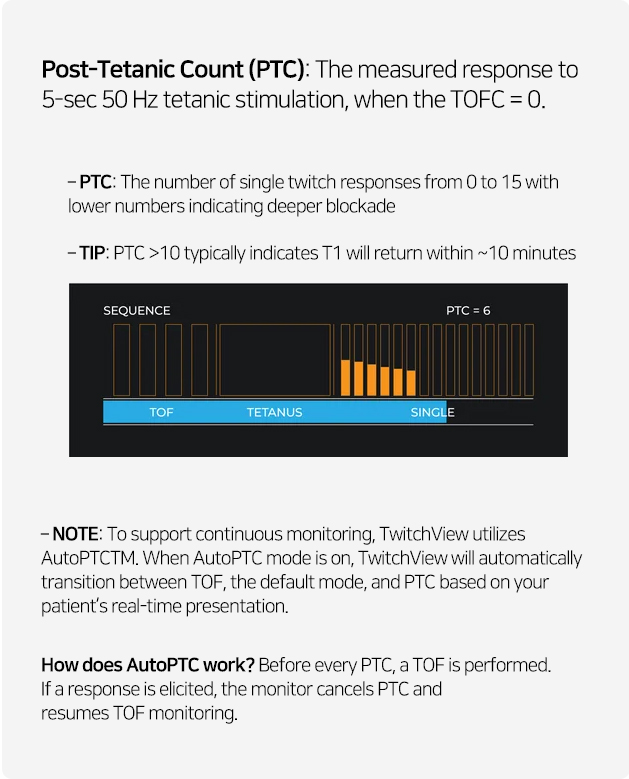
5. The first time the TOFC = 0, AutoPTC is triggered.
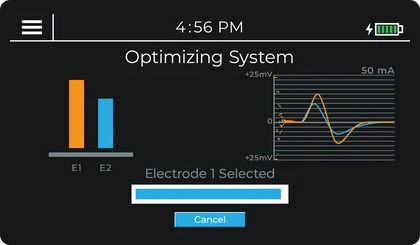
Pre-paralytic start-up is recommended to confirm correct electrode placement and to allow the monitor to select the electrode with the largest EMG signal and set the optimal stimulating current. However, TwitchView can be utilized post-paralytic with default settings.
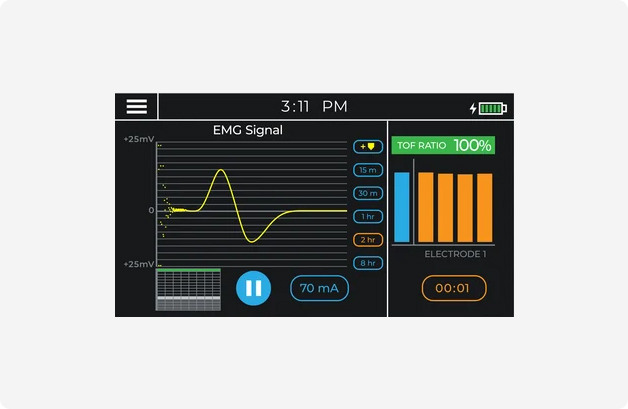
- Waveform is sinusoidal and large in amplitude
- TOFR ~100%.
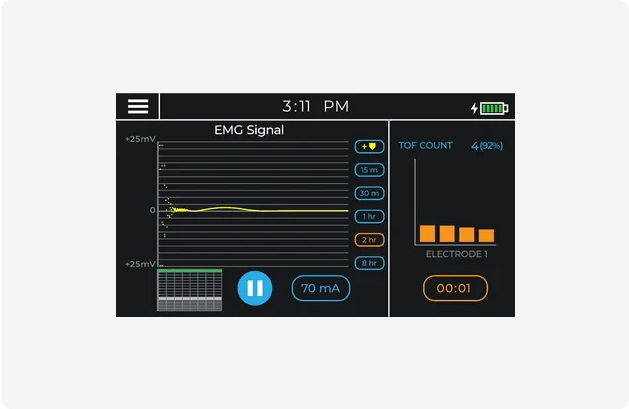
- Waveform is relatively flat
- Monitor indicates poor signal with a TOFR in parenthesis
If the EMG signal is poor or the monitor sets a high stimulating current (≥70mA), reposition the stimulation leads, start a New Session on the TwitchView and redo quickstart.
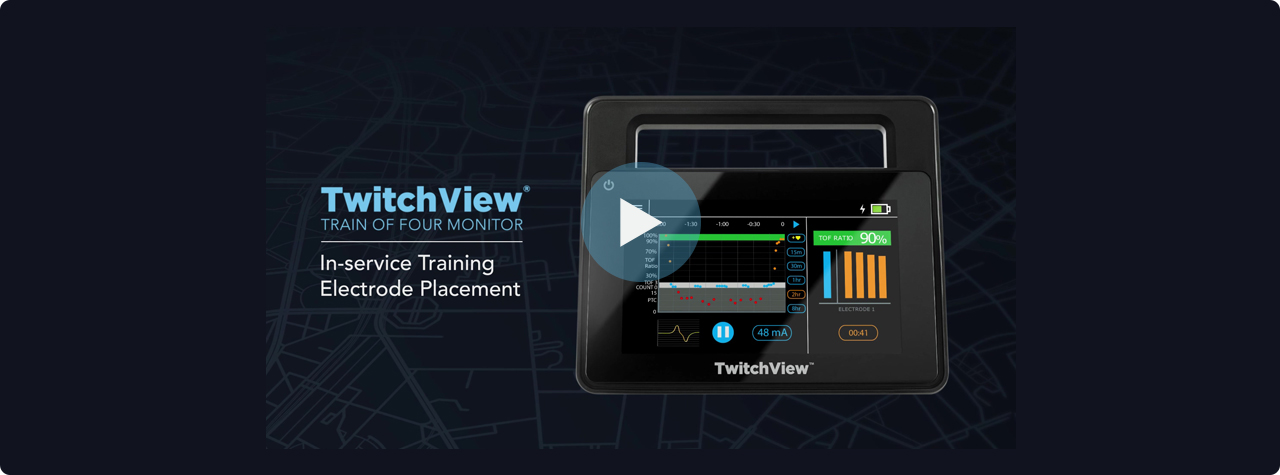
Watch the video below for an overview of TwitchView monitor function.
Every time TwitchView takes a measurement, a data point is plotted on the trend plot. The trend plot enables you to visualize how neuromuscular blocking agents affect each patient differently. Using the trend plot, you can proactively manage the patient's level of blockade intraoperatively—redosing NMBA according to the individual patient's response and the required surgical conditions.
To view the trend plot, touch the box in the bottom left corner of the TwitchView display. The most recent data point will always be to the right of the plot near 0. You can adjust the trend plot timescale by pressing 15m, 30m, 1hr, 2hr or 8hr and scroll back by pressing the blue arrow.
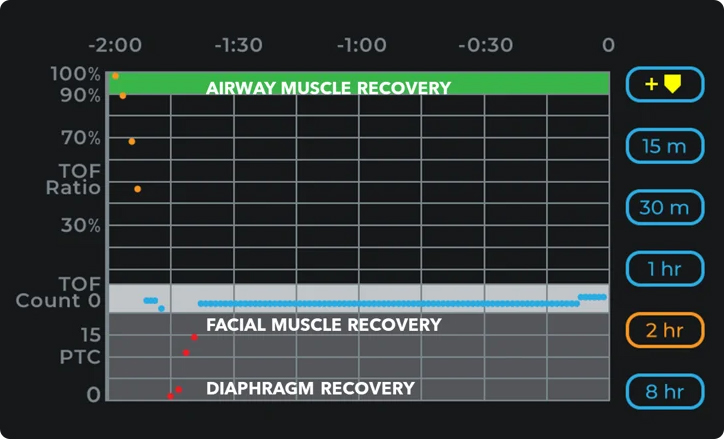
- A dot in green indicates a TOFR of >90%
- A dot in black indicates TOFR<90%
- A dot in light gray indicates a TOFC<90%
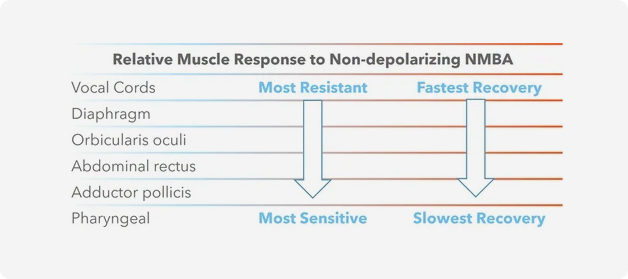
- The trend plot pictured indicates periods to expect relative muscle recovery rates.<90%
Many institutions implement literature-based reversal guides to use the information provided by TwitchView to 1) select the appropriate reversal drug and 2) dose the selected reversal in accordance with the patient's real-time need.
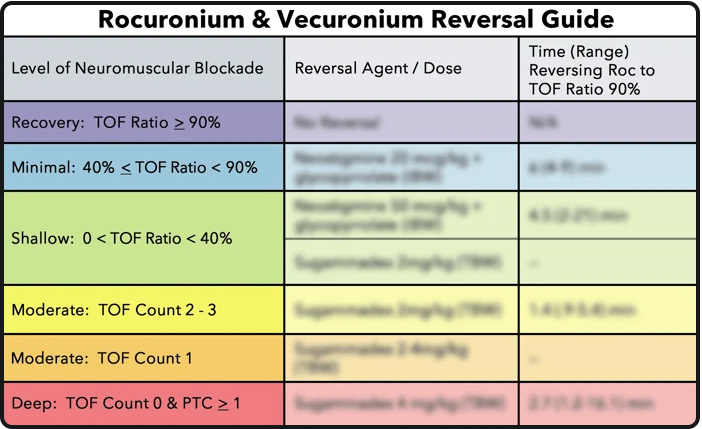
A typical dose of rocuronium (0.6 mg/kg) has a median clinical duration of 31 minutes in adults, but the duration can vary substantially from patient to patient and range from 15 to 85 minutes.3
A TOFC 4 on the face may be accompanied by a TOFC 1 or PTC at the hand.1
Normal end-tidal CO2 and tidal volumes are also common during profound neuromuscular blockade
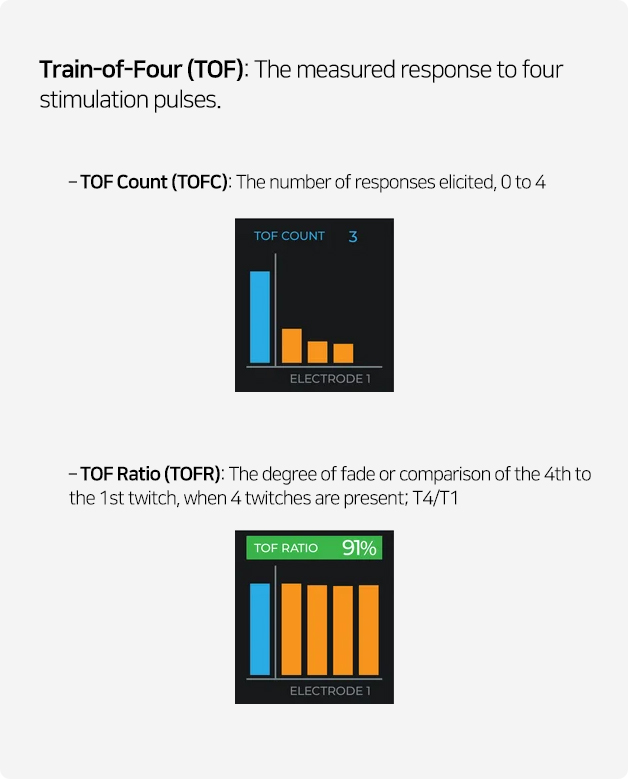
The clinical standard for “adequate recovery” is a TOFR ≥0.9 measured at the adductor pollicis muscle.
Looking for detailed specifications? Download the TwitchView IFU.