| 제목 | How Quantitative Train of Four Impacts Rocuronium Reversal |
| NO | 4 |
| Date | 2024-02-26 |
| 조회수 | 196 |
| 출처 | Justin Hulvershorn, MD, PhD |
"The Sugammadex Effect"Has your department increased utilization and dosing of rocuronium in general anesthetic cases? During a session at Anesthesiology 2022, one presenter labeled the phenomenon as “The Sugammadex Effect," the increased use of both rocuronium and sugammadex.
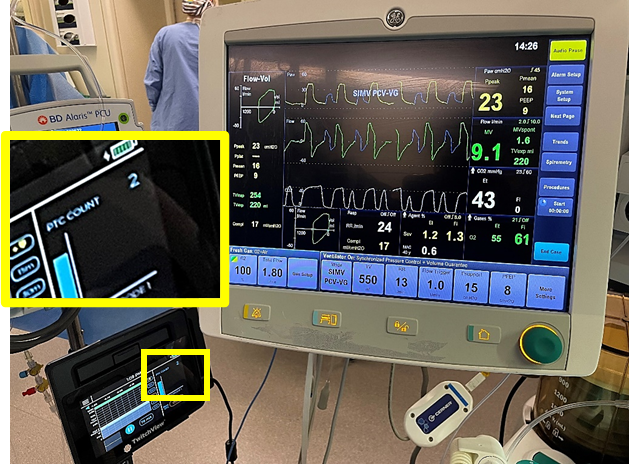
While we do not know with certainty what is driving the increased use of rocuronium, we do know that quantitative twitch monitoring allows clinicians to individualize dosing of rocuronium by observing the effects of dosing and the rate of spontaneous recovery of the train-of-four response to ulnar nerve stimulation. Reduce Reversal Costs without Compromising Patient SafetyIn a study performed at Harborview Medical Center, clinicians utilized TwitchView, an EMG based quantitative neuromuscular monitor and a protocol to guide management and reversal of neuromuscular blockade, resulting in a 0% incidence rate of residual paralysis or PRNMB. Sugammadex was utilized in 48% of all patients and 17% of the patients in the mixed surgical population achieved adequate spontaneous recovery and did not need any pharmacological reversal. Of note, Thilen et al. achieved this groundbreaking advance in patient safety while maintaining a role for neostigmine as a reversal strategy, resulting in pharmacologic cost savings of $42 per patient. [3].
Anesthesia Provider Practice Changes with Quantitative Train of FourUtilizing screenshots from the TwitchView, we will illustrate how anesthesia providers like those in Dr. Thilen's study can evolve their utilization of neuromuscular blocking and reversal agents when presented with continuous data. Every time the TwitchView takes a measurement, a dot is plotted on the trend plot. The most recent measurement is potted at right by 0:00, and the depth of blockade increases downward. When the monitor is started pre-NMBA administration, the first measurements will fall within the green bar indicating a TOFR >90%. Dots below the green bar represent progressively deeper levels of blockade, and as you look left to right, dots trending upward indicate patient recovery. The following two clinical cases illustrate a typical evolution in practice when introducing the TwitchView trend plot into patient care.
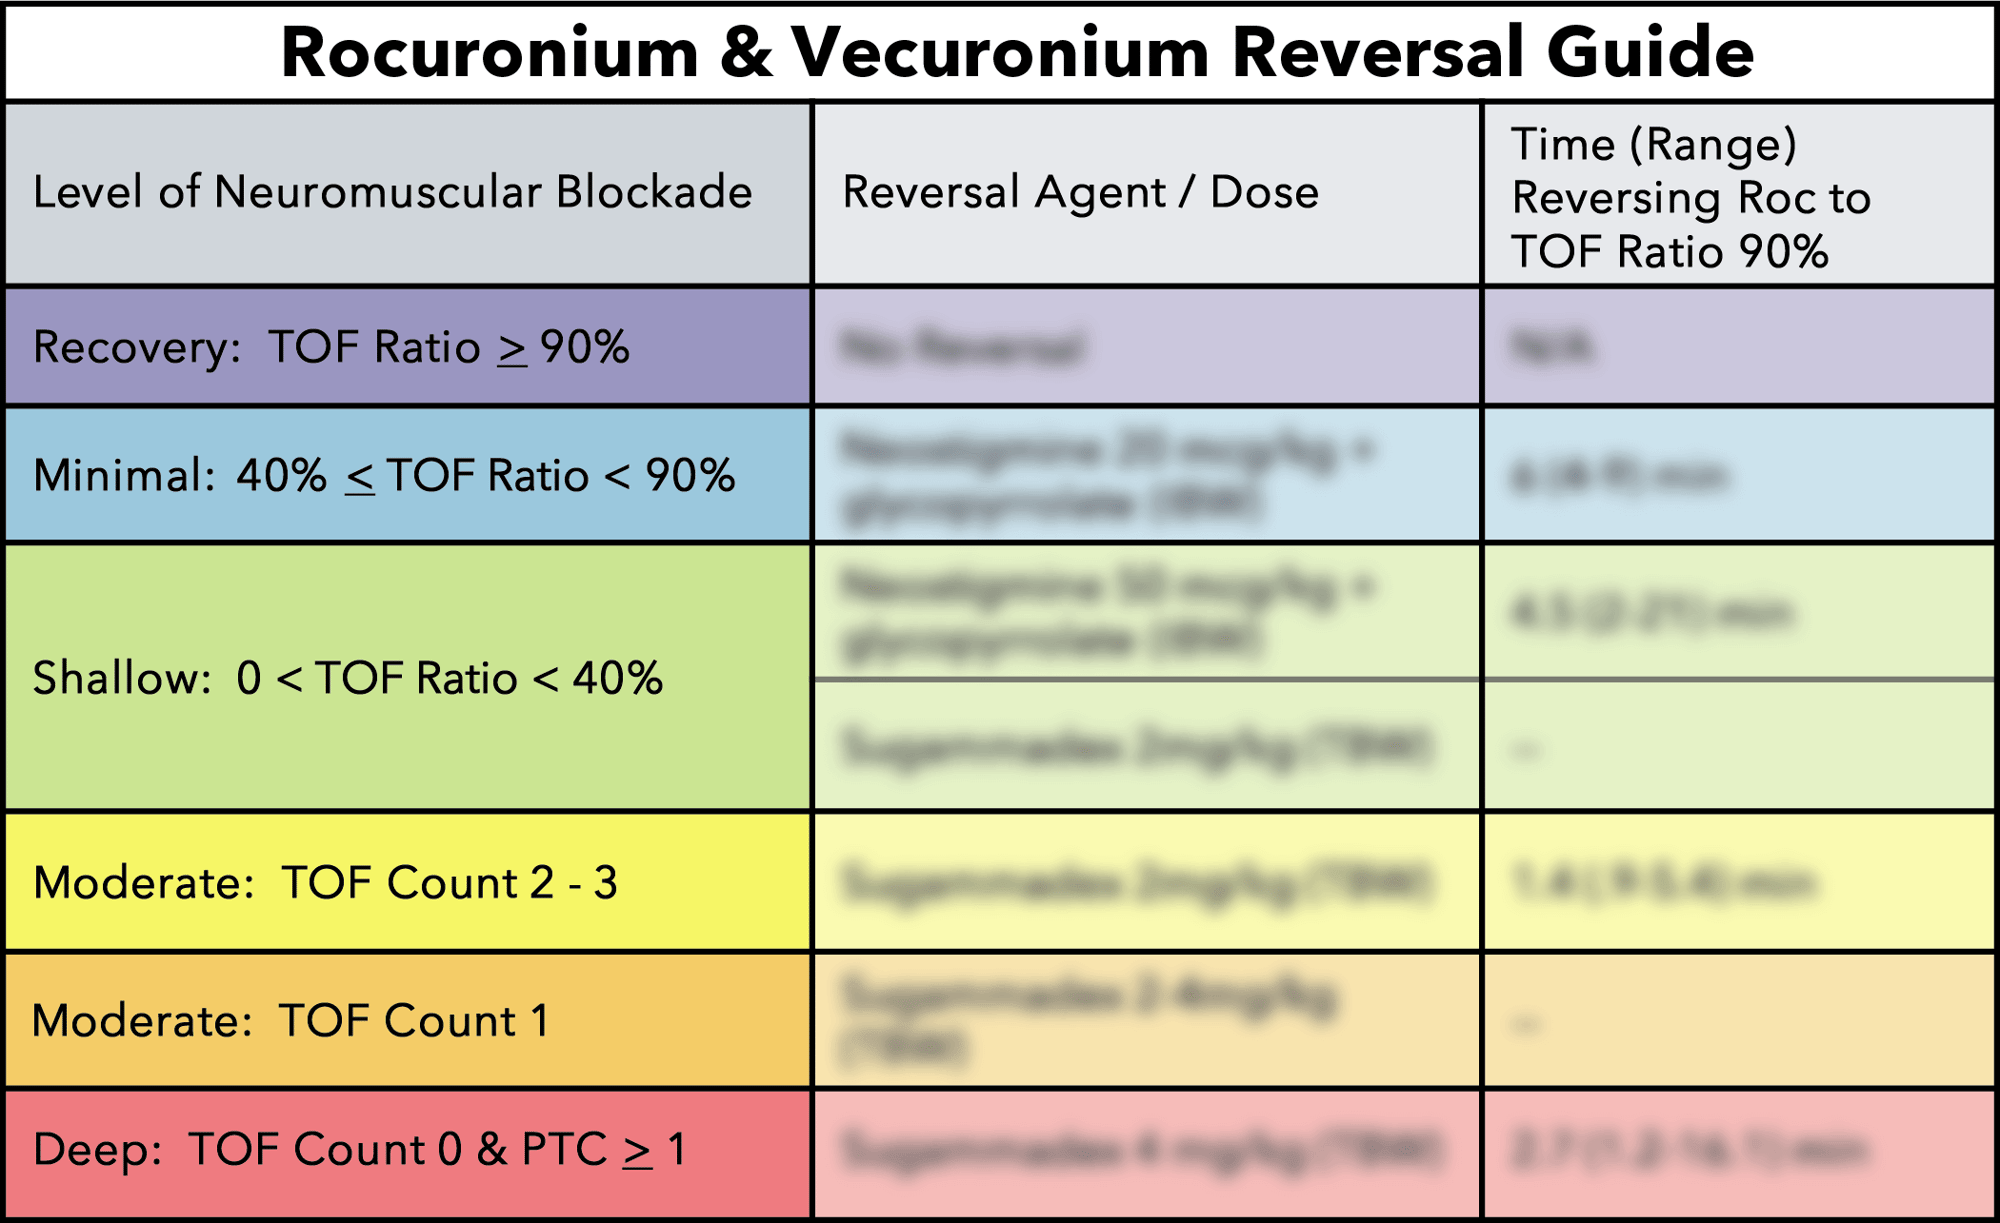
When presented with the continuous, real-time data, the clinician adjusted dosing in accordance with the individual patient’s rate of recovery. In this instance, the provider was able to maintain the required surgical conditions while significantly reducing their dosing of rocuronium. The adjustment led to a more recovered patient at time of reversal enabling the provider to follow the ASA guideline recommendations to utilize neostigmine to reverse minimal blockade.
Figures 5 & 6: Levels of Neuromuscular Blockade and recommendations for reversal of blockade defined by the 2023 ASA Practice Guidelines. Source: 1 Rocuronium Duration of Action and Rocuronium ReversalWhile overall rocuronium utilization may be increasing as pictured in Figure 1, a blanket reduction is not the solution. Patient response to rocuronium is highly variable and continuous real-time data empowers the provider to tailor their dosing strategy according to the individual patient’s need just as they would with any other pharmacologic intervention. The following trend plots illustrate two very different patient responses to the same 0.6 mg.kg−1 intubation dose. Patient 1 recovered to a TOF Count 4 after 30 minutes while Patient 2 took 90 minutes to reach the same level of recovery.
Figure 7: Two-hour trend plot window from two different patient responses to the same 0.6 mg.kg−1 intubation dose of rocuronium. In terms of intraoperative blockade management, Patient 1 would need a redose within the first hour to maintain moderate blockade, but additional relaxant would have caused unnecessary profound block in Patient 2. While this is readily apparent when provided with continuous, trended data, most providers have never been able to visualize how neuromuscular blocking agents affect individual patients. The well-documented variability in patient response to rocuronium is depicted in the plot below from Debayne et al. In the study, many patients required three hours or more to recover from a typical intubating dose. Conversely, some patients were almost completely recovered only 30 minutes after the intubating dose was administered. Of note and aligning with concerns that drove creation of the ASA guidelines, greater than 30% of patients who received no muscle relaxants during the last two hours of their procedure arrived to the PACU with residual paralysis (a TOF Ratio < 90%).
Again, quantitative monitors are a tool to guide patient-specific management of neuromuscular blockade. As a bonus, resulting changes in practice can enable safe utilization of neostigmine. The plot below overlays the expected recovery rate from sugammadex (open circles) over an actual neostigmine reversal (closed circles). Neostigmine can take up to 15 minutes for maximal effect, while sugammadex typically reverses patients in a couple minutes. Using the trended data, many providers begin reversing their patients earlier when using neostigmine to prevent delays at the end of the case while waiting for the patient to recover to a TOF Ratio >90%.
To learn how TwitchView can help you eliminate Post-operative Residual Neuromuscular Blockade at your facility, click 'Learn More' below. References:
|
|
| 첨부파일 | |


|
|
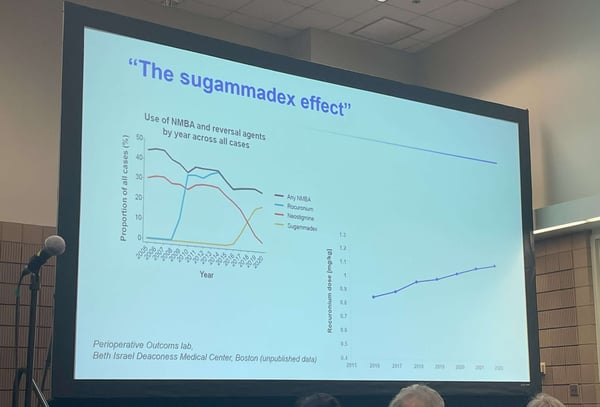 Figure 1: Image of Slide titled ‘The Sugammadex Effect’ containing department utilization of NMBA and reversal agents by year (left) and rocuronium dosing by year (right) taken at ASA 2022. Source: author
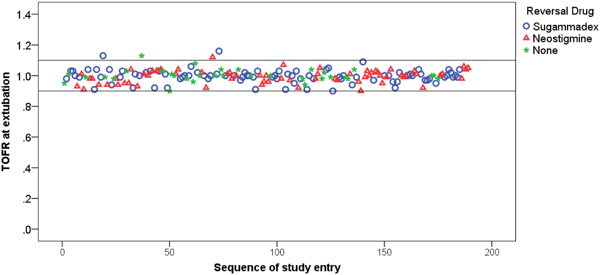 Figure 2: Scatterplot of individual patient TOFR (train-of-four ratio) at time of extubation portraying 0% incidence of post-operative residual neuromuscular blockade achieved by Thilen et. al. The horizontal line at TOFR = 0.9 corresponds to the criteria for postoperative residual neuromuscular blockade. Reversed with Sugammadex n=90, Reversed with Neostigmine n=66, Not reversed n=33. Source: 3
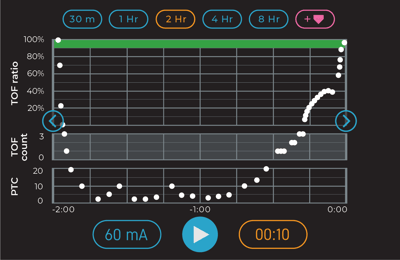 Figure 3: In their first case, the clinician maintained their typical rocuronium dosing strategy for both intubation (50 mg) and maintenance (20 mg). At closure, Neostigmine was administered at a TOF Count 2 and recovery stalled at a TOF Ratio of 50%. Sugammadex was administered, and the patient recovered rapidly to a TOF Ratio of 100%.
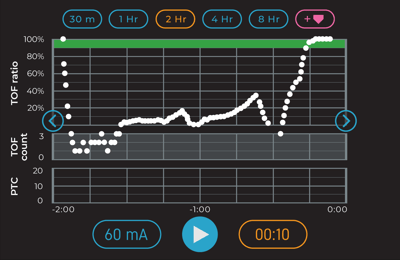 Figure 4: After noting the deep blockade induced in the previous patient, the provider reduced their standard induction dose of 50 mg to a calculated 0.6 mg/kg dose of 30 mg of rocuronium. Intraoperative maintenance doses were reduced from 20 mg to 10 and 5 mg of rocuronium. By closure, the patient spontaneously recovered to a TOF ratio of 50%, and the patient was successfully reversed (TOF ratio of 100%) using neostigmine.
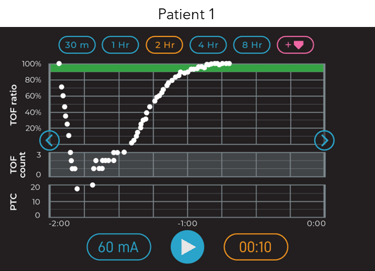
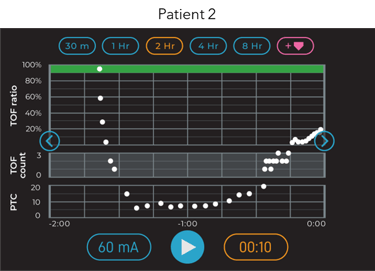
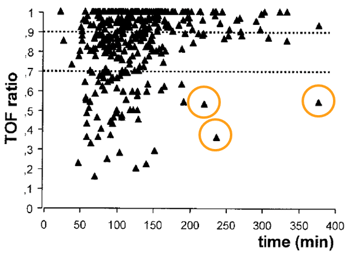 Figure 8: Train of four (TOF) ratio versus time interval between injection of rocuronium (n = 402) and assessment. Each symbol represents one patient. Upper dotted line shows the 0.9 TOF ratio threshold. Source: 2
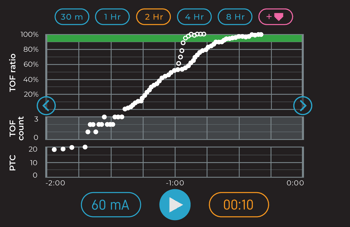 Figure 9: 2-hour trend plot image of neostigmine reversal from TOF Ratio 60% and projected sugammadex reversal from the same level of recovery.
.jpg?width=393&height=365&name=Mechanomyograph%20(2).jpg)